
Graduation rates at the College contain racial disparities, but narrower than national averages
May 10, 2023
A Record investigation found that Black and Hispanic students at the College graduate at lower rates than their white and Asian peers — though the disparities are far smaller at the College than at the national level.
Institutions of higher education throughout the country face racial disparities in graduation rates. Data from the National Center for Education Statistics (NCES) indicates that only 45 percent of Black, bachelor’s degree seeking students who entered college in 2015 graduated within six years — 20 percentage points below the national average. By contrast, 68 percent of white students and 78 percent of Asian students in the same cohort completed their degrees within six years.
Vice President for Institutional Equity, Diversity, and Inclusion Leticia S.E. Haynes ’99 said that the College remains focused on combating what she described as “any troubling racial disparities in graduation rates at the College,” though it boasts rates far above national averages. She pointed in particular to cultivating community among BIPOC students, faculty, and staff and providing academic spaces where BIPOC students feel supported.
The data
Any four-year institution of higher education that receives federal funding for student financial aid must report the percentage of students who graduate within six years to the federal government. The government also requires institutions to break down this information by certain demographic categories, including race, financial aid status, and gender.
Highly selective, private institutions like Williams tend to boast higher graduation rates than public colleges and universities. For the cohort entering the College in 2015, the Office of Institutional Research reported a six-year graduation rate of 94 percent — significantly higher than the national average of 65 percent. BIPOC students at the College also graduate at rates higher than average, with six-year rates for Asian, Black, and Hispanic students from the same cohort year hovering at 95, 90, and 87 percent, respectively.
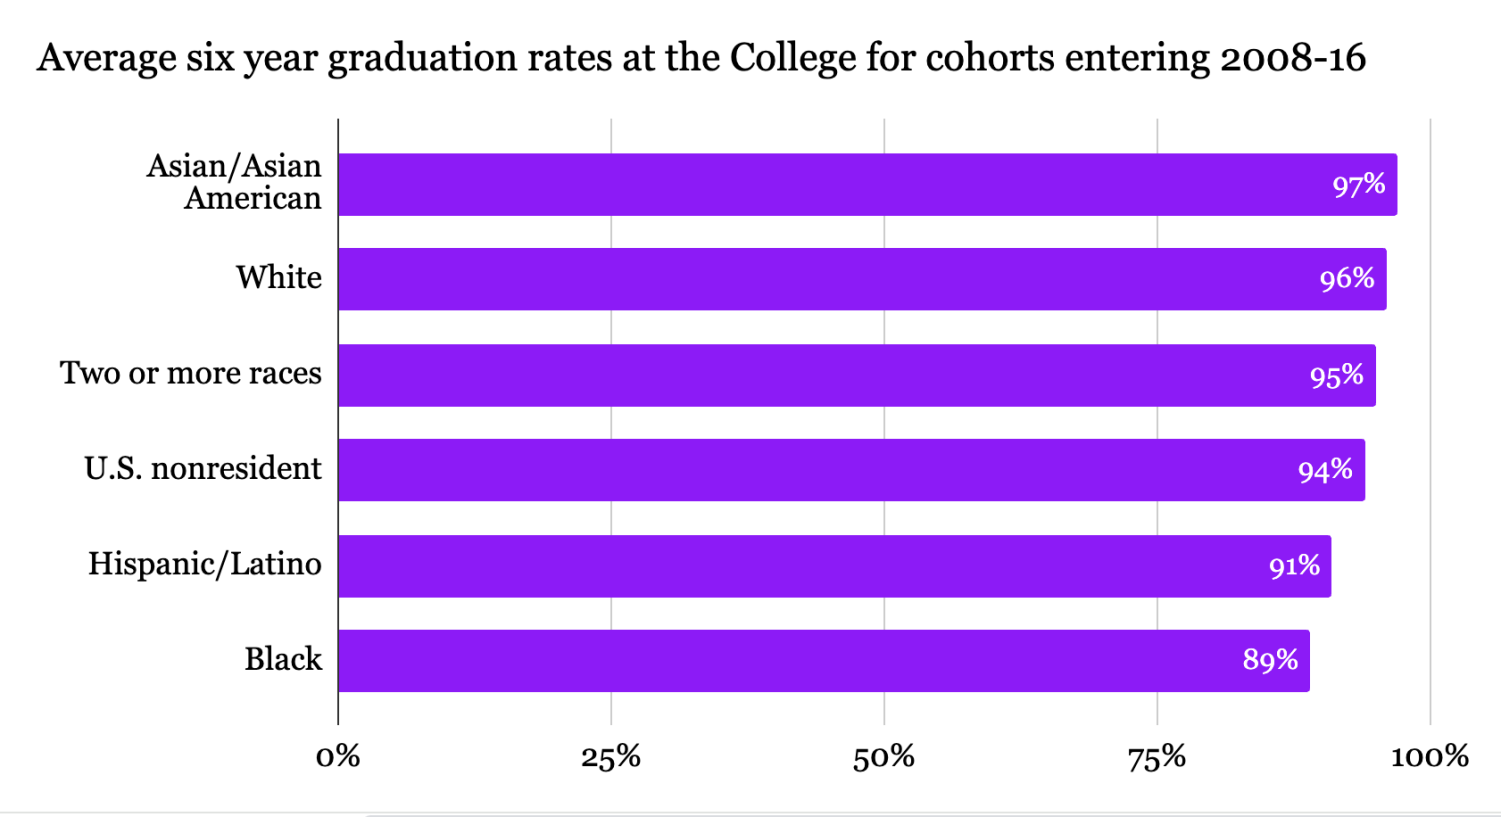
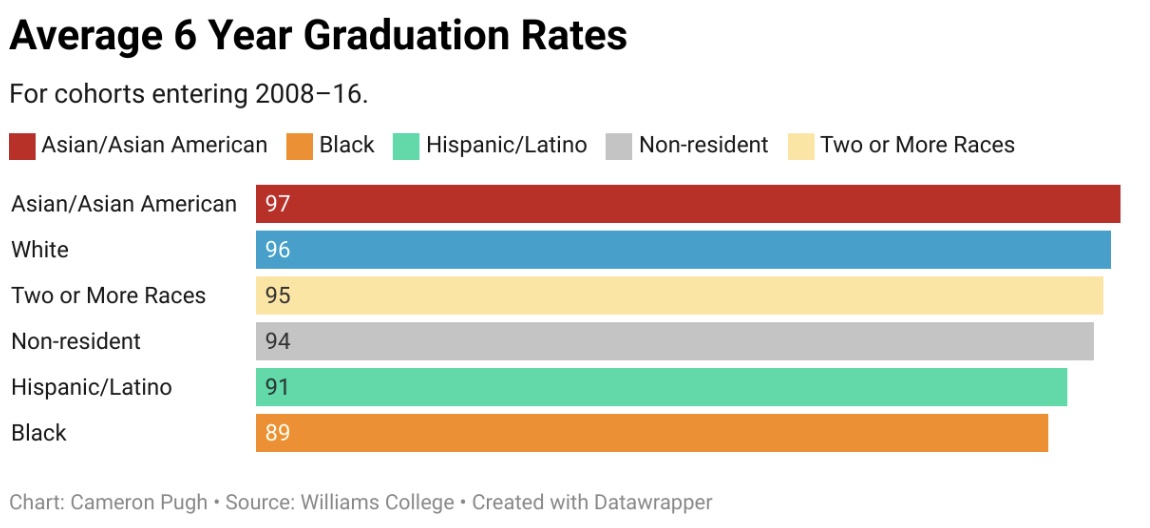
Despite high individual year totals, average graduation rates at the College are stratified by race. Black and Hispanic students, on average, reported the lowest graduation rates of all racial groups for which the College posted data. Though the College reports data on its website up until 2016, federal data lags behind by one year. The average six-year graduation rates for Black and Hispanic students who entered the College between 2008 and 2016 were 89 and 91 percent, compared to 96 and 97 percent for white and Asian students.
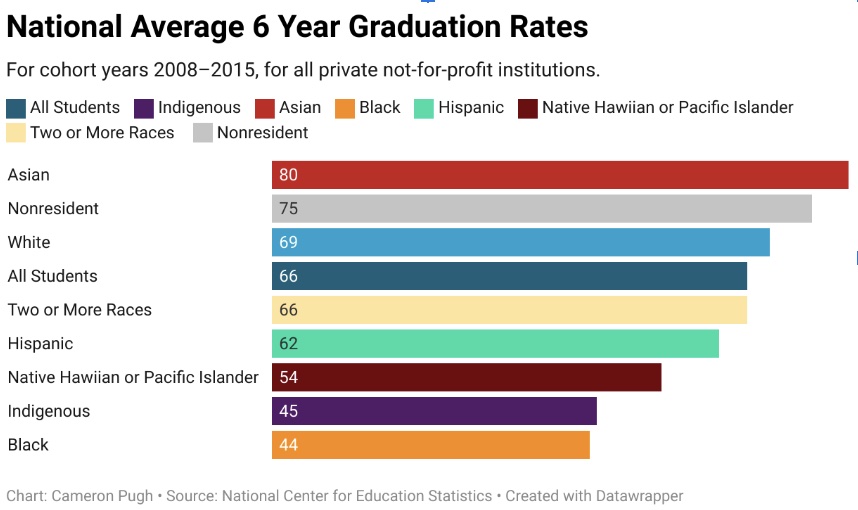
Other private, not-for-profit institutions see similar trends. Nationally, for cohort years 2008–2015, the groups with the lowest average graduation rates were Black, Indigenous, Native Hawaiian or other Pacific Islander, and Hispanic, with average rates of 44, 45, 54, and 62 percent, respectively.
Though it is required to report graduation data for Indigenous and Pacific Islander students to the federal government, the College does not publish this data on its website. In an interview with the Record, Associate Director of Institutional Research James Cart ’05 said that small enrollment numbers make it difficult to draw meaningful conclusions about graduation rates for these students unless the College aggregates data over several years. Additionally, Cart said that the College does not publish graduation rate data on its website for these groups in part because their small cohort size might make it possible to determine which students did or did not graduate. According to the Common Data Set for the 2022–23 academic year, only one student at the College solely identified as a Pacific Islander, and none identified as Indigenous — numbers that Cart described as typical.
A variety of factors may contribute to racial disparities in college completion nationally. The Hechinger Report — a nonprofit newsroom focused on education — reports that financial pressure, whether it be a lack of money or the need to work a job while in college, is a primary factor in lowering graduation rates for Black, Hispanic, and Indigenous students at public institutions. Social isolation and exclusion are other factors that may cause BIPOC students to leave school early or take longer to graduate. A study by the Urban Institute also found that much of the disparity between Black and white students’ graduation rates can be attributed to pre-college inequities in finances and college readiness.
Haynes emphasized that feeling a sense of belonging may be a major factor affecting graduation rates at the College. She pointed to resources and programs that the Office of Institutional Equity, Diversity, and Inclusion (OIDEI) and Pathways for Inclusive Excellence offer to help BIPOC students build supportive communities.
“OIDEI has worked to help individuals, particularly from groups historically underrepresented in [higher education], to build community,” she wrote in an email to the Record. “We encourage participation in pre-first year programs like Summer Humanities and Social Sciences [SHSS] and Summer Science [SSP] where individuals can build long-lasting cohorts in the academic environment that can positively impact their time in college.”
SHSS and SSP are five-week, residential summer programs for incoming first-years from historically underrepresented backgrounds offered through Pathways for Inclusive Excellence. The programs introduce students to the resources available at the College and college-level classroom instruction to ease the transition from high school to college.
Haynes also pointed to the valuable ties that students may build with faculty and staff of color through these programs. “Entering students will not only hear about available resources but also have individuals they can go to in times of celebration or need,” she said.
“The entire OIDEI team also works to increase the competencies of faculty and staff at the College to make this a more inclusive and equitable space,” she continued.
The COVID-19 pandemic also had a significant effect on general graduation rates at the College, Cart said. He pointed to racial and economic differences in which students chose to take time off during the pandemic as one factor that could have changed graduation rates.
While the College has demographic data on which students took time off during the pandemic, it does not publish this information. For the cohort year 2017 — which would include all students originally in the Class of 2021, the first class to enter their senior year amid the pandemic — the College reported a four-year graduation rate of 74 percent, a 14-point decrease from the previous year. Four-year rates declined across all racial groups except Black students, for whom rates increased. White students saw a 19-point decrease in four-year graduation rates — the largest of any group. A 2020 Record article reported that a higher percentage of white students elected to take time off at the start of the pandemic than any other racial group.
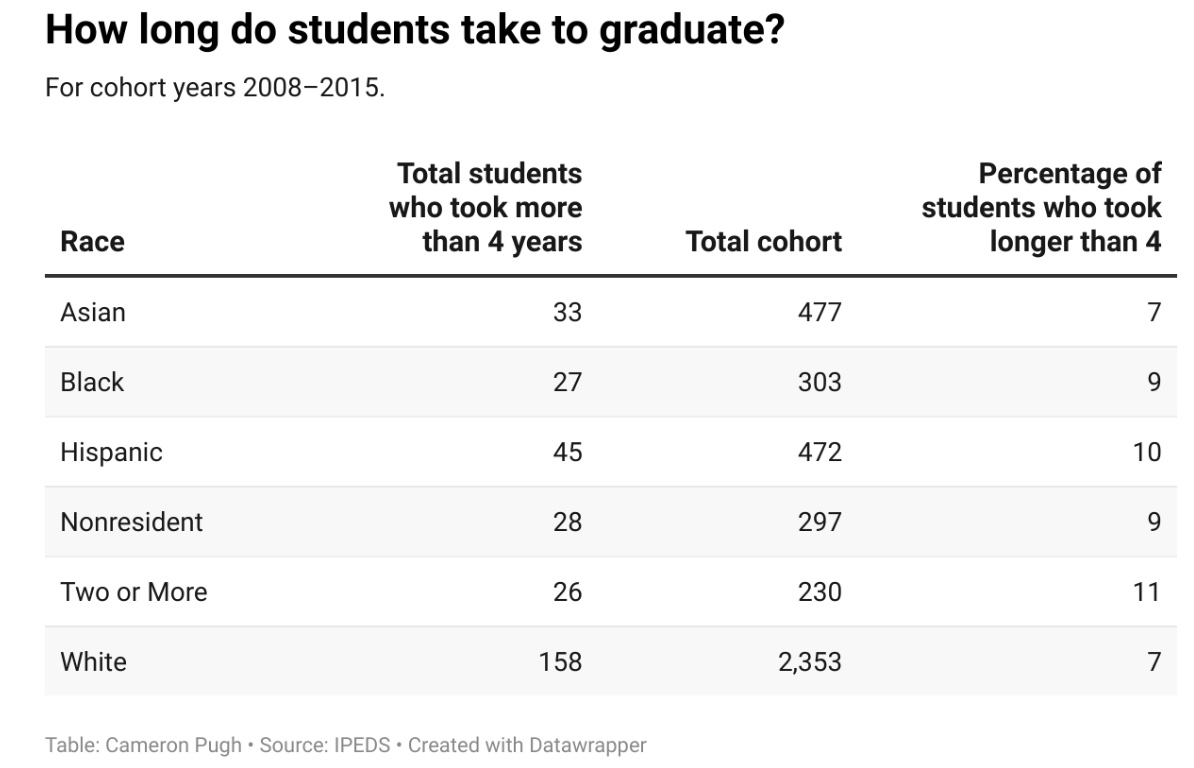
At the College, Black, Hispanic, U.S. nonresident, and multiracial students also tended to take longer to complete their degrees than white and Asian students before the onset of the pandemic. Data from the NCES on cohort years 2008– 15 revealed that 11 percent of multiracial students took longer than four years to graduate, compared to 7 percent of white and Asian students. Ten percent of Hispanic students and 9 percent of Black and U.S. nonresident students took longer than four years to complete their degree.
Though six-year graduation data is not yet available for the cohort year 2017, five-year graduation rates posted on the College’s website suggest that the pandemic may have changed these trends. Roughly, 26 percent of white students took an extra year to graduate, compared to only 4 percent of Black students. For Hispanic, Asian, U.S. nonresident, and multiracial students, approximately 20, 12, 19, and 24 percent took an extra year to graduate, respectively.
Limitations of the data
The data the College reports to the federal government, which is drawn from information students enter on their application to the College, is limited in a number of ways, Cart said. In particular, he highlighted the limitations of the racial and gender categories the government requires colleges and universities to use.
Reporting requirements from the government collapse students with multiple racial or ethnic identities into a single category. For example, students who select more than one race on their application are filtered into a separate category and are not considered under the racial identities that they selected. Similarly, Hispanic students are listed only as Hispanic, and any other identities with which they may identify are not considered. Students studying in the United States on a visa are also filtered into the separate category of nonresident.
Additionally, students’ conceptions of their identities may change over time, and until recently, it was not possible for students to update the categories they checked on their applications.
Several weeks ago, the Diversity Advisory Research Team (DART) and the Trans Inclusion Committee — in partnership with staff from institutional research, the Registrar’s Office, the Office of Information Technology, and admissions — enabled a feature on PeopleSoft that allows students to change the racial categories under which the College lists them. PeopleSoft also now allows students to select a third, write-in option for the previously binary gender option and asks a new question about trans identity.
The College is still required to report graduation data using the categories provided by the government. But Associate Provost for Analytics and Institutional Research Courtney Wade said that these recent changes, which included a “cleanup of race and ethnicity data in PeopleSoft,” will allow the College to update its internal data collection policies to make them more accommodating of multiple identities.
“What we would prefer to do for internal reporting, and can now do as a result of this data cleanup, is count students under all the categories with which they identify,” Wade wrote in an email to the Record. “We’re still required to report on graduation rates using the categories you see on our website, but in addition to that, we’ll now be able to look at the data in this new way, with greater confidence that it’s accurate.”
Looking to the future, Haynes said that Assistant Vice President for Institutional Equity, Diversity, and Inclusion Ivonne García — who joined the College in January — plans to evaluate leave patterns to assess how the College can support its students.