On Monday, Oct. 26, the Record sent out an anonymous survey to the entire student body asking questions about the U.S. presidential election. The results indicate overwhelming disapproval of President Donald Trump coupled with widespread support for former Vice President Joe Biden, as well as 99 percent turnout among respondents who were registered voters. Additionally, three issues stood out as the most important to students: the COVID-19 pandemic, inequality and climate change.
A total of 862 students responded to the survey — more than a third of those enrolled at the College. Nonetheless, response bias could still be present, and it is important to be cautious of extrapolating the statistics in this article to the entire student body.
Where and how did students vote?
The largest number of respondents cast their ballots in Massachusetts, with New York close behind. Notably, all five of the most common states are rated as “Solid Democrat” states by the Cook Political Report, and the students voting in just those five make up more than half of all respondents to the survey.
Almost nine out of 10 registered voters among respondents voted by mail. As of Oct. 28, the last day in which survey responses were accepted, just 2.6 percent had voted, or were planning to vote, at a polling place in Williamstown. Only 1 percent did not plan to vote.
As for the partisan makeup of respondents, 72.6 percent identified as Democrats while 20.4 percent described themselves as independent or unaffiliated. Just 33 respondents, or 4.1 percent, identified as Republicans.
Whom did they vote for?

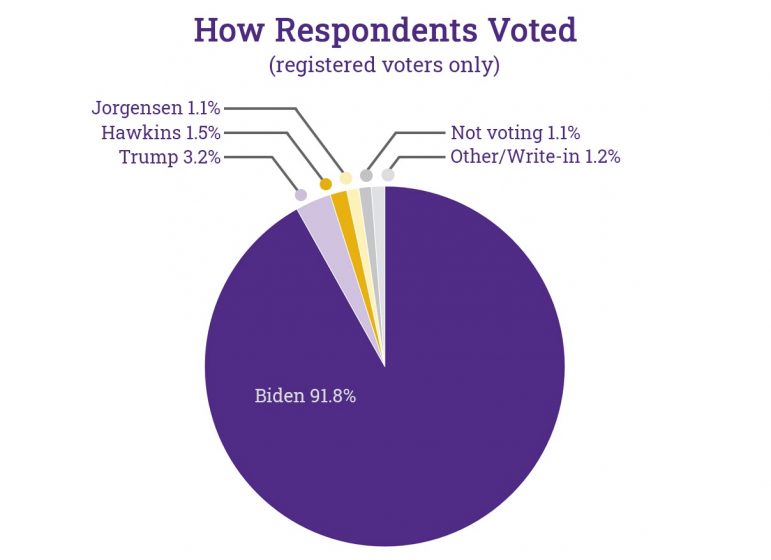
Respondents who were registered to vote overwhelmingly indicated that they voted or intended to vote for Biden at a rate of 91.8 percent, while Trump’s share was 3.2 percent. In addition, third-party candidates Howie Hawkins and Jo Jorgensen each got just over 1 percent of the vote. Just 1 percent did not plan on casting a vote for president.
Biden got the votes of almost 20 percent more students than identified as Democrats. Trump’s vote share remained close to the share of survey respondents who were Republicans.
The vote shares for Trump and third parties differed between respondents who used he/him versus she/her pronouns. The percentage of he/him students voting for Trump was double that of she/her students. While Biden had the votes of a vast majority among both groups, he performed better with she/her students. It appears that the gender gap that pollsters have observed on a national level persists within the Purple Bubble.
At the end of the survey, participants were asked if they would be willing to be interviewed by the Record. Many Biden voters, as well as at least one voter each for Jorgensen and Hawkins, obliged. Not one Trump voter did.
Why did they vote this way?
Approval ratings showed moderate approval for Biden and strong disapproval of Trump. Trump’s net approval (calculated by subtracting “disapprove” ratings from “approve” ones) was -92.5 percent, while Biden’s was +22.7 percent.
The Record also asked respondents to rate Trump’s handling of the COVID-19 pandemic, and the breakdown of this statistic was very close to Trump’s approval numbers. He had a net disapproval of 93 percent for his handling of the pandemic, compared to an overall net disapproval of 92.5 percent.
When students were asked to choose the most important issue to them from a list based on a Knight Foundation poll, a clear top five emerged. The COVID-19 pandemic came at the top, having been selected by just over 30 percent of students. Climate change and inequality tied for second, followed by a third tier occupied by White House leadership and race relations.
The Record also offered a more subjective prompt: “Describe why you’re voting the way you are in less than five words.” The results were wide-ranging, but there were a number of identical answers. The most common ones reveal the motivations of many students: voting Trump out. The three “Lesser of two evils” voters preferred Biden.
For a broader snapshot of the responses, here are three word clouds created from them. The first is of all voters’ responses, the second just those of Biden voters and the third Trump voters. Note that the lower proportion of Trump voters led to a narrower range of words used.
All respondents:
Biden voters:
Trump voters:
There was one final thing we asked respondents to do: predict the winner of the presidential election. It is worth noting that “I don’t want to jinx it” and “I don’t know” were not listed as options, but variants of them were written in by dozens of respondents.
Only time will tell who gets it right.
A .csv file of the data we collected can be found here. Note that personal details have been removed when relevant, including state of residence, race and ethnicity, in order to ensure the anonymity of respondents. Use it as you wish — and if you do something cool with it, whether it’s modeling, data visualization, or otherwise, please tell [email protected]!


