As the fall semester approached, Nathan Thimothe ’22 and Gavin Li ’22 saw an inefficiency in the College’s “COVID-19 dashboard” — and with it, an opportunity. The statistics on cases and testing provided by the dashboard were not being regularly disseminated or promoted to community members, and the page could be found only after multiple clicks into the College’s website.
“I noticed that we were spending a lot of time just trying to get to the COVID dashboard,” Li said. “The process took a bit longer than we wanted it to.” A possible solution, he thought, could be to deliver a summary of the dashboard to students on a platform they would already be using.
“We figured, ‘Why not put this on some sort of social media?’” Li said. “And we instantly thought of Twitter.”

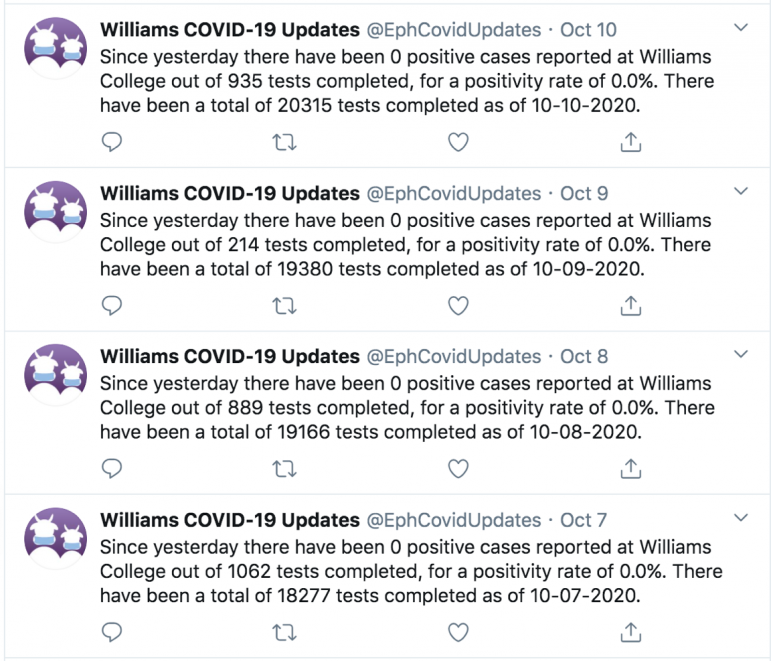
Starting Sept. 21, Li and Thimothe’s @EphCovidUpdates Twitter account began to automatically post daily updates about the College’s COVID-19 statistics. As of press time, it had accrued 77 followers.
Li and Thimothe, both of whom are majoring in computer science, created the project using the programming language Python.
“At noon every day, there’s a computer somewhere in OIT [the Office for Information Technology] — one of the WSO servers — that is responsible for telling the program to go and grab information from the coronavirus dashboard,” Thimothe said.
This information gets saved in a file, and then the program checks for the day-to-day difference in cumulative tests and cases. “From there, you can determine the positivity rate for that day,” Thimothe said.
Through this process, the program summarizes any changes in the data since the previous day and posts them on Twitter.
“Every week, we give a weekly update on what’s happening,” Li added. “This isn’t information that’s from the COVID dashboard directly. This is information that we extract away on our own. And we just think about, how can we share this information on a large scale, so we can show cumulative results. So that way users can get a full scope of what’s going on with COVID numbers on campus.”

Soon after its creation, the account caught the attention of the official @WilliamsCollege Twitter account, which has joined the ranks of its followers.
“They present [the College’s COVID-19 statistics] in a little bit of a different way, and I’m assuming that the stats they post each day are sort of what they, as students, want to see,” said Abby Wood Meczywor ’10, who is in charge of the College’s Twitter account. “I saw they added in the positivity rate, which I thought was an interesting stat to put in there, and they do it daily, which is really helpful.”
Both Director of Institutional Research Jason Rivera and Vice President for Finance and Administration Fred Puddester expressed their approval of the Twitter bot.
“It’s publicly available data, right?” Rivera said of the statistics on the COVID-19 dashboard. “That was the intention; it’s meant to kind of be there. And I think if other students find that bot informative, I think that it’s a useful tool.”
“If it’s easier for someone just to whip out their phone and get a Twitter feed, all the better,” Puddester said. “As long as it’s accurately pulling our data off [the dashboard], I think that’s fine.”
Meczywor stressed the importance of transparency in communicating COVID-related data to the public. “One thing we learned along the way is that there’s no such thing as too much information,” Meczywor said of her experience presenting COVID-related news to the community. “Especially with the dashboard, we saw that people wanted more details.”
Yet the ability of Li and Thimothe to work with this information exists only to the extent that the College makes it available. Several types of statistics remain absent from the College’s dashboard, including information on disciplinary measures, quarantine and isolation capacity, and statistics over time. Other NESCAC schools have chosen to include a larger variety of figures on their dashboards, including data visualizations and charts.
“There is the public dashboard, which is pretty sparse,” Rivera said of the College’s site. “I think it has all the information that it needs. But senior staff also does have a much more detailed, internal, confidential dashboard, [with which] we’re tracking a lot more information.”
“It’d be kind of a boring chart,” Puddester added in reference to a potential cases-over-time graph, given that only four students have had positive tests since the campus reopened.
Rivera also noted that where quarantine and isolation numbers are concerned, the College aims to avoid infringing on the privacy of students. “With the isolation numbers, they’re so small that we really want to try to be fair to the people who have tested positive,” he said.
As far as the Twitter bot is concerned, Thimothe has found the dashboard sufficient in its current form. “We work with what we’re given,” he said. “I am satisfied with what they have provided so far.”
However, he did identify a different kind of constraint on the project: the regularity with which the dashboard is updated. “One thing that we were struggling with at first was what time they were updating their information,” he said. “They say on the website ‘every morning,’ and that is not very specific. Because of that, we had to write more code to check actually what time they’ve been updating every day.”
Despite such complicating factors, the reach of the account has already spread beyond students. After it was mentioned in the Daily Messages, multiple professors at the College including Sarah Jacobson and Magnus Bernhardsson followed it.
Li and Thimothe emphasized that their project is a work in progress that is meant to be responsive to students’ interests.
“I would love it if people just DMed us feedback,” Thimothe said. “We would take a look and maybe implement changes. I’m very open to that.”


