In recent weeks, Berkshire County, like the rest of Massachusetts, has seen a continued increase in COVID-19 cases, according to the state’s Department of Public Health (DPH). The figures below show the current severity of the outbreak at the local and state levels. Map and bar graph data is courtesy of the Massachusetts DPH, and pie chart data is courtesy of Berkshire Health Systems. Both sites update their numbers daily; the figures for this article were most recently updated yesterday afternoon.
These maps show both the total number of cases by county (top) and number of cases per 100,000 residents by county (bottom) as of yesterday. (Graphic by Joey Fox/The Williams Record.)
In this bar graph listing the number of confirmed COVID-19 deaths per 100,000 residents by county, Berkshire County has a rate of 28, which is on the lower end of Massachusetts counties. Throughout the commonwealth, the average age of individuals confirmed to have died of COVID-19 is 82. (Graphic by Sofie Jones/The Williams Record.)
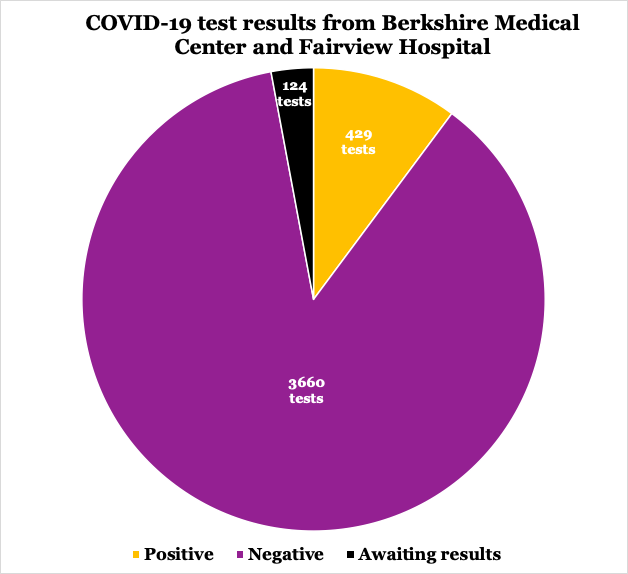
As of yesterday, Berkshire Health Systems had administered COVID-19 tests to a total of 4,213 people. Excluding tests that are still awaiting results, 10.5 percent of all tests came up positive. (Graphic by Rebecca Tauber/The Williams Record.)
Sofie Jones ’22 is an English major from Belmont, Mass. She is a senior writer. She previously served as a managing editor, and before that, as executive editor and section editor for sports.
Email: [email protected]
Twitter: @sofeljones
Jeongyoon Han ’21 (she.her.hers) is a political science and Chinese major from Syracuse, N.Y. She is a senior writer and a video producer. Previously, she served as the 2020 summer/fall editor-in-chief, a managing editor, and as an executive and section editor for Features.
Rebecca Tauber ’21 is a history and English major and Jewish studies concentrator from Lower Merion, Pa. She was a senior writer. Before that, she served as news editor, executive editor for communications and podcast, and as a managing editor.
Email: [email protected]
Twitter: @retauber
Comments (0)
AllThe Williams Record PicksReader PicksSort: Newest